February 10, 2025

Cupid’s arrow shooting spree is finally over!
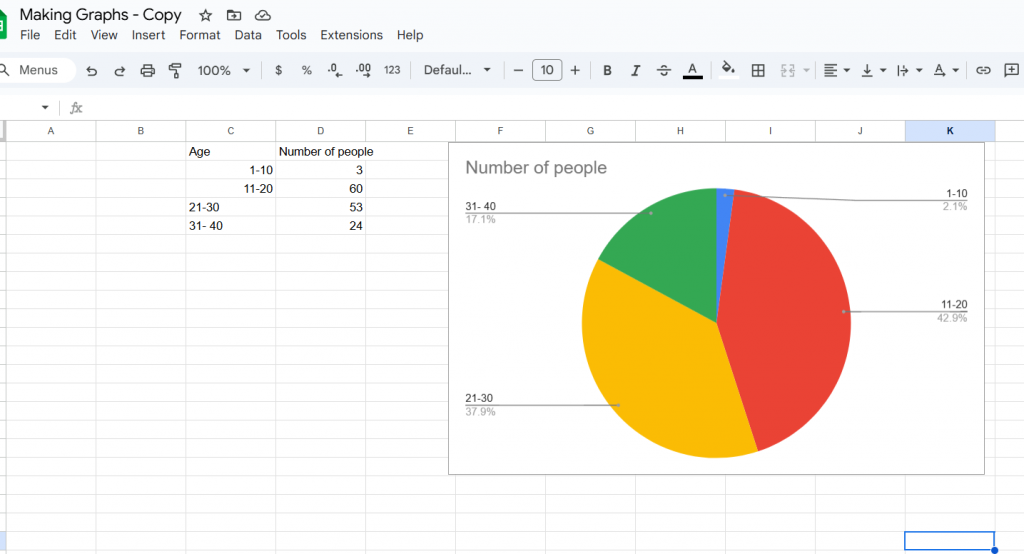
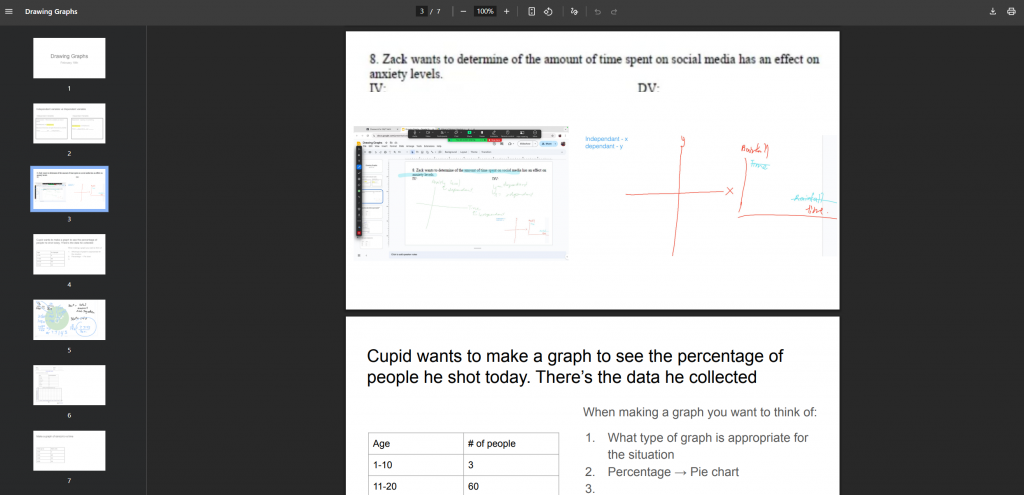
Now he wants to see just how many hearts he hit today! How will he graph it out? This lesson covers transforming everyday data into visuals by understanding the concepts of independent and dependent variables. Explore which graphs best tell the story behind our numbers.
Check out the Lesson